|
| 2 Disclaimer [Placeholder] |
| Disclaimer (Cont’d) 3 [Placeholder] |
| Introduction |

| 5 Presenters Today [Placeholder] |
| 2017 2014 2012 2011 1999 2005 2009 2010 / Note: $ in billions. Figure represents sum of market cap, as of February 23, 2021, for public companies and acquisition valuation for those acquired. $775B+ one’s Track Record of Early Investments in Transformational Businesses 6 2021 / |
| one’s Criteria for Partnership Founders, Visionaries, Operators Strong Technology / Defensible Positioning Benefiting from Transformational Trends / Velocity of Digitization Opportunity to Utilize Capital to Drive Growth / Strengthen Moats Enduring Businesses 7 Markforged |
| 8 Limited Design Flexibility (1) United States Census Bureau “Connecticut Case Study: Attracting Skilled Manufacturing Workers a Challenge as Aging Baby Boomers Retire” – November 17, 2020. (2) “Manufacturing Wastes 10% of the GWP Every Year. Here’s Why” Forbes article – October 18, 2019. Inability by Manufacturers to Hire Skilled Workers1 Inability to Effectively Respond to Supply Chain Disruption 20% of Every Dollar in Manufacturing is Wasted (10% of Global GDP)2 Limitations of Traditional Manufacturing 01 02 03 04 |
| Customers essentially could choose between >$1M “industrial machines” or hobbyist printers Before Markforged, Customers Had Limited Options |
| Offers design flexibility and industrial-strength parts with highly accessible solutions Markforged Transforms the Industry |
| Markforged’s Digital Forge A Differentiated and Integrated Platform 9 metal and composite printers and sintering furnaces, which continue to get smarter1 Software Materials Printers Cloud-first architecture provides powerful yet easy-to-use solutions Unlocks range of new applications across 14 proprietary materials1 Metal X X7 Mark Two 11 (1) As of January 2021. |
| Markforged at a Glance 12 Large and Growing TAM $115B by 20301 25% Projected 2021-2030 CAGR Positioned for Robust Growth 10x $700M+ Projected 2025 Revenue Proven Scale with Blue Chip Customers $72M 2020 Revenue Large and Growing Installed Base ~10K à 70K+ Projected Connected Printers 2020- 2025 Attractive Margin Profile 58% 2020 Gross Margin Source: Wohlers Report 2021. |
| The Next Chapter |

| 14 Wide range of proprietary composite and metal materials address broad range of applications Mission-critical application for blue-chip customers with evidenced land-and-expand Continuous software updates drive faster innovation and deployment More customers > More part data > Printers get smarter > Better parts Markforged — Accessible, Industrial-Grade Solution, Today Upgrading metal with advanced composites High and tangible customer ROI Integrated, modern software platform Scale today drives virtuous cycle |
| The Future is More Than Metal 15 [Placeholder] |
| The Future of Distributed Manufacturing 16 FPO FPO [Placeholder] |

| The Markforged Solution 17 The mini factory of the future – delivering production parts at the point-of-need. The Digital Forge “Right now, the sky is the limit honestly with this printer. If you can think of it, we can literally do it.” – Marine Staff Sgt. Quincy Reynolds of the III Marine Expeditionary Force’s 3rd Maintenance Battalion1 (1) http://www.stripes.com/news/pacific/cutting-edge-Okinawa-marines-say-new-metal-3d-printer- opens-up-a-whole-1.616511 Note: Use of quote does not imply endorsement. Quote refers to Metal X System (not pictured). |
| Accessible Additive Composites 18 Markforged’s Continuous Fiber Reinforcement proprietary process for Advanced Composites. Onyx base material Continuous fiber inlay |
| Aluminum 37% Steel 35% Plastic 21% Carbon-Fiber 6% Fiberglass 1% Replacing Traditionally Manufactured Steel and Aluminum Parts Tensile Strength (MPa) Frequency of Original Material Replacement by Survey Respondent Application Customers are replacing legacy plastic and metal parts with Markforged proprietary Continuous Fiber Reinforced (CFR) composites CFR is 11x stronger than Onyx and 25x stronger than ABS plastic1 Majority are replacing metal parts2 19 (1) Markforged internal test results as of December 2020. (2) Markforged Proprietary Survey of 90 Customers as of October 2019. 32 71 310 800 0 200 400 600 800 1000 ABS Plastic Markforged - Onyx Aluminum (Aircraft Grade 6061) Markforged - CFR 72% |
| Markforged 2.0 – From Accessible End-Use Parts to Robust Production |
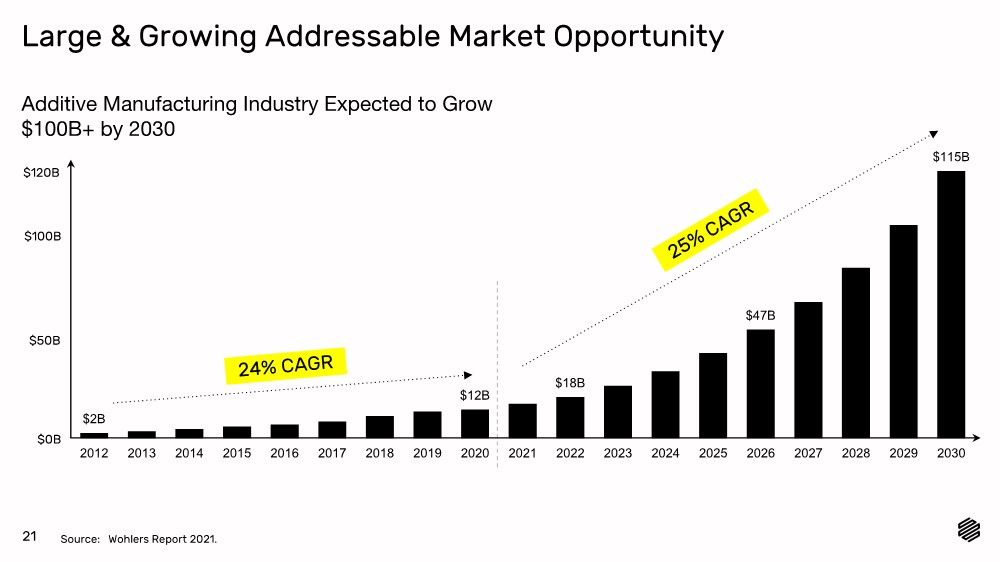
| $2B $12B $18B $47B $115B 2012 2013 2014 2015 2016 2017 2018 2019 2020 2021 2022 2023 2024 2025 2026 2027 2028 2029 2030 Large & Growing Addressable Market Opportunity Source: Wohlers Report 2021. 25% CAGR Additive Manufacturing Industry Expected to Grow $100B+ by 2030 21 $120B $100B $50B $0B 24% CAGR |
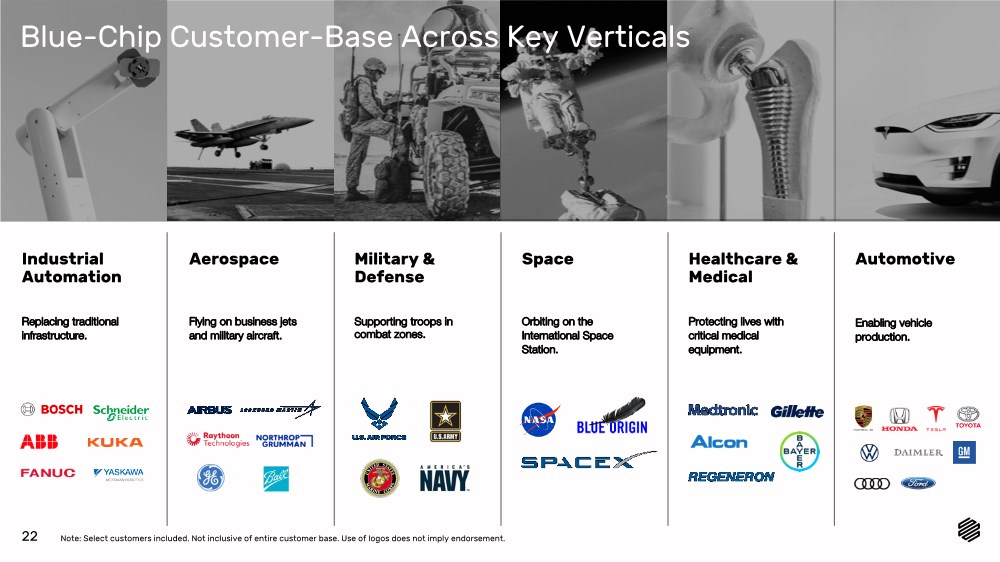
| Industrial Automation Replacing traditional infrastructure. Automotive Enabling vehicle production. Space Orbiting on the International Space Station. Aerospace Flying on business jets and military aircraft. Military & Defense Supporting troops in combat zones. Healthcare & Medical Protecting lives with critical medical equipment. 22 Blue-Chip Customer-Base Across Key Verticals Note: Select customers included. Not inclusive of entire customer base. Use of logos does not imply endorsement. |
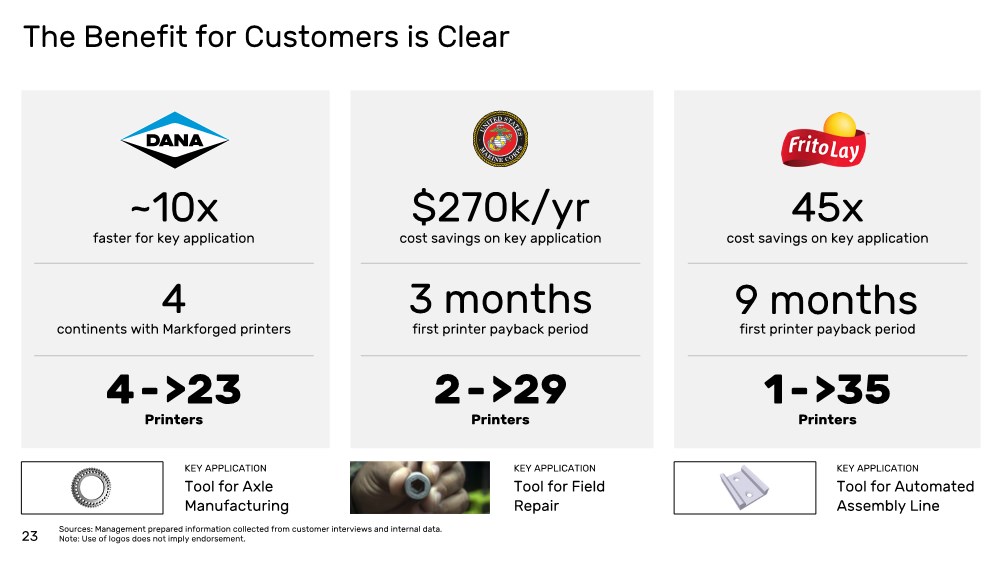
| KEY APPLICATION The Benefit for Customers is Clear 23 ~10x faster for key application 4 continents with Markforged printers 4->23 Printers Tool for Axle Manufacturing $270k/yr cost savings on key application 3 months first printer payback period 2->29 Printers KEY APPLICATION Tool for Field Repair 45x cost savings on key application first printer payback period 1->35 Printers 9 months KEY APPLICATION Tool for Automated Assembly Line Sources: Management prepared information collected from customer interviews and internal data. Note: Use of logos does not imply endorsement. |
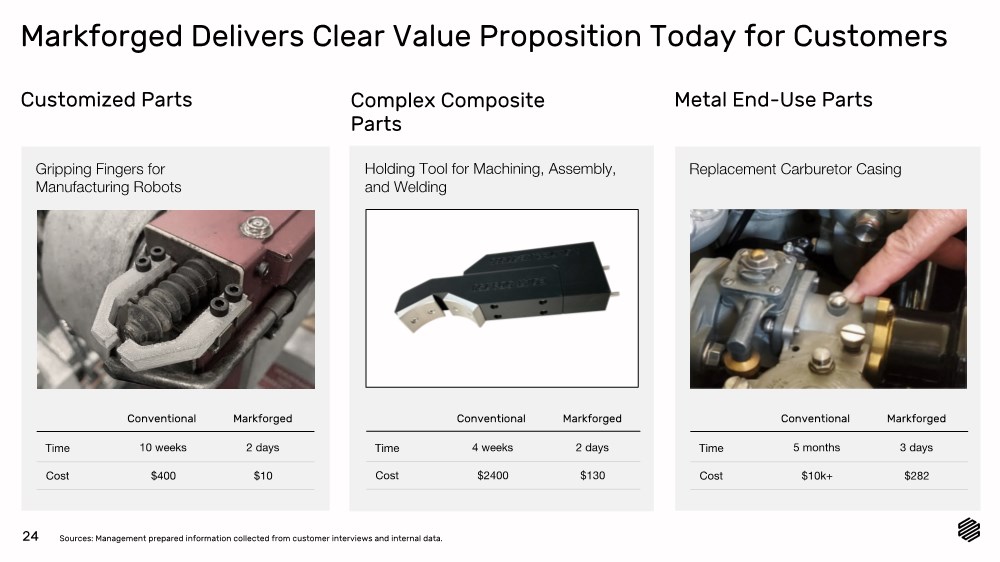
| Markforged Delivers Clear Value Proposition Today for Customers 24 Customized Parts Gripping Fingers for Manufacturing Robots Conventional Markforged 10 weeks 2 days $400 $10 Time Cost Complex Composite Parts Holding Tool for Machining, Assembly, and Welding Conventional Markforged 4 weeks 2 days $2400 $130 Time Cost Metal End-Use Parts Replacement Carburetor Casing Conventional Markforged 5 months 3 days $10k+ $282 Time Cost Sources: Management prepared information collected from customer interviews and internal data. |
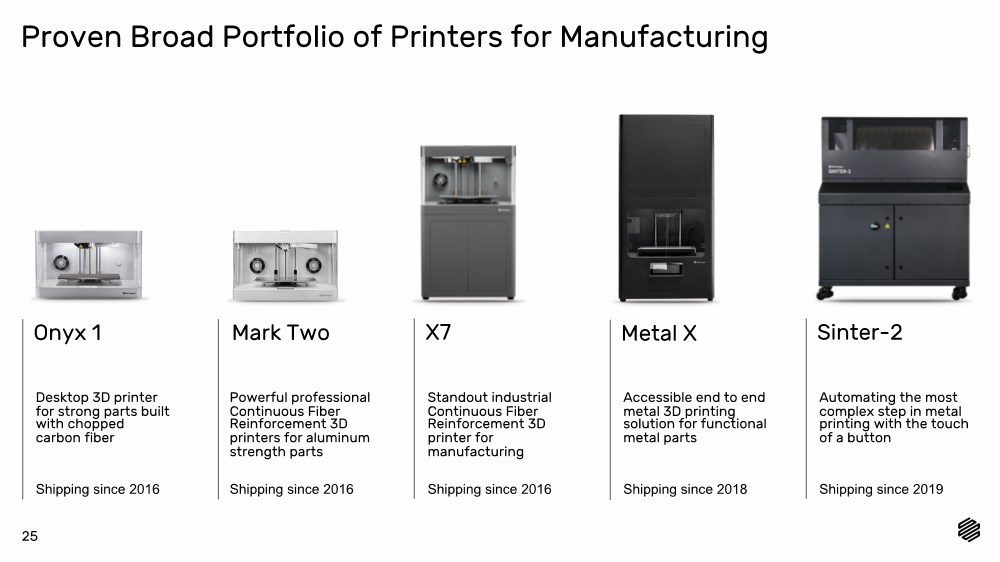
| Onyx 1 X7 Metal X Sinter-2 Proven Broad Portfolio of Printers for Manufacturing Mark Two Accessible end to end metal 3D printing solution for functional metal parts Automating the most complex step in metal printing with the touch of a button Desktop 3D printer for strong parts built with chopped carbon fiber Standout industrial Continuous Fiber Reinforcement 3D printer for manufacturing Powerful professional Continuous Fiber Reinforcement 3D printers for aluminum strength parts Shipping since 2016 Shipping since 2019 Shipping since 2018 Shipping since 2016 Shipping since 2016 25 |
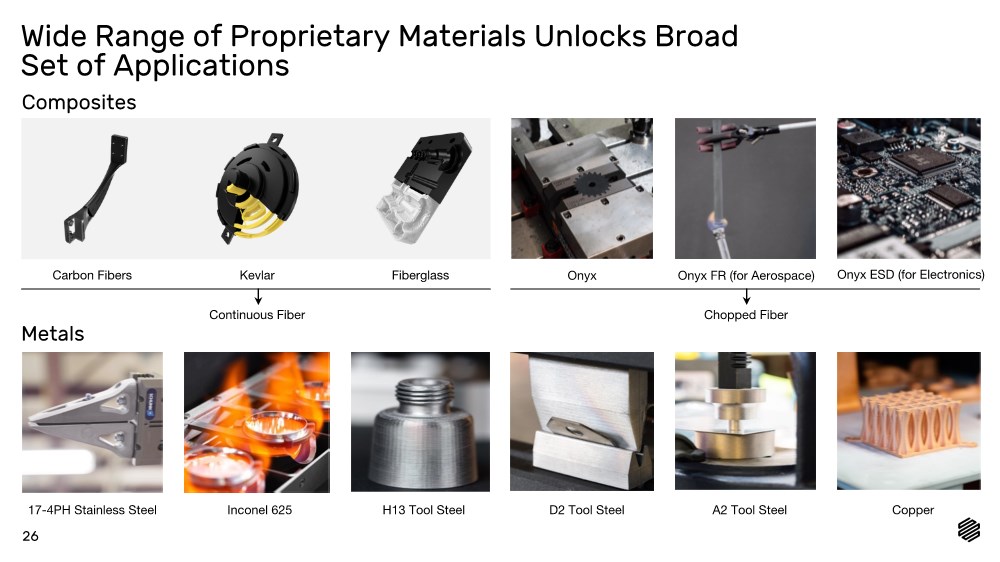
| Wide Range of Proprietary Materials Unlocks Broad Set of Applications Composites Metals Inconel 625 H13 Tool Steel D2 Tool Steel A2 Tool Steel Copper Carbon Fibers Kevlar Fiberglass Continuous Fiber Onyx Onyx FR (for Aerospace) Onyx ESD (for Electronics) Chopped Fiber 17-4PH Stainless Steel 26 |
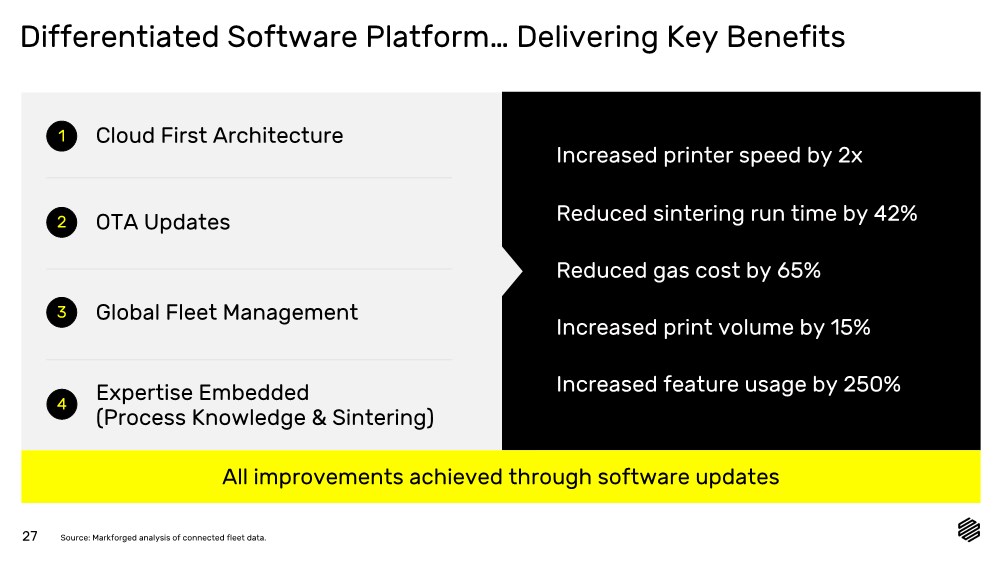
| Differentiated Software Platform… Delivering Key Benefits Increased printer speed by 2x Reduced sintering run time by 42% Reduced gas cost by 65% Increased print volume by 15% Increased feature usage by 250% 27 Cloud First Architecture 1 OTA Updates 2 Global Fleet Management 3 Expertise Embedded (Process Knowledge & Sintering) 4 All improvements achieved through software updates Source: Markforged analysis of connected fleet data. |
| Our Scale Advantage; Fueling The Markforged Flywheel Grow Expertise at the Speed of Global Production New printers are added to network to scale manufacturing capacity Consistent Improvement Part Scanning + Industrial IoT Drives AI-powered part quality improvements across entire fleet Printers Get Smarter More Customers More Part Data Better Parts Federated fleet learning combined with real-time part corrections create a reliable and repeatable production process Devices are constantly streaming back data on parts and performance Part Prep and Fleet Management 28 |
| Strong Distribution Channels with Global Coverage 100+ certified channel partners ~1,000+ GTM talent within channel partner network Markforged distribution channel presence as of January 2021. 29 |
| VAR Network We have strategically constructed our reselling network to drive our business. Global Global footprint provides scale and wide coverage Additive Focused on providing best-in-class additive solutions Software- based Leveraging large install base to deliver complete solutions 30 Federal Focused on Government, Military & Defense Note: Select VARs included. Not inclusive of entire distribution network. |
| Experienced & Visionary Management Team to Drive Us Forward Dorit Liberman Chief Human Resources Officer Brian Houle VP Sales, EMEA Michael Papish VP Marketing Greg Mark Co-Founder & Chairman Mark Schwartz Chief Finance Officer Ved Narayan VP Sales, APAC Patrick Shea VP Demand Generation Leadership David Benhaim Co-Founder & Chief Technology Officer Founders Shai Terem President & Chief Executive Officer Bryan Painter VP Sales, Americas Ken Clayton SVP, Global Sales Engineering Go-to-Market Leadership 31 Matt Gannon VP, Operations Dan Eiref Senior Director Product Management Joe Roy- Mayhew Senior Director Materials Stephen Karp General Counsel |
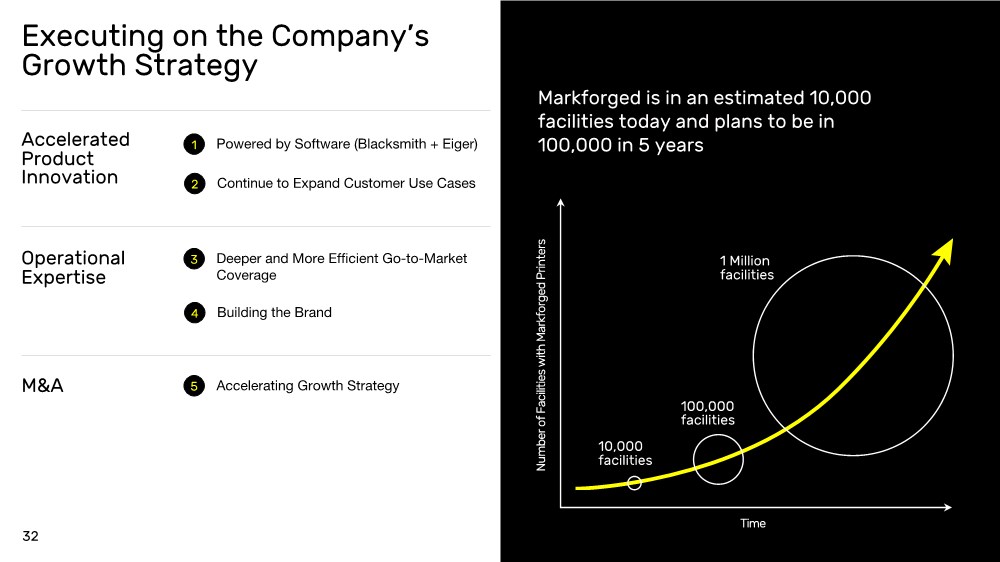
| Executing on the Company’s Growth Strategy Accelerated Product Innovation 10,000 facilities 100,000 facilities 1 Million facilities Markforged is in an estimated 10,000 facilities today and plans to be in 100,000 in 5 years 32 Operational Expertise M&A Powered by Software (Blacksmith + Eiger) 1 Continue to Expand Customer Use Cases 2 Deeper and More Efficient Go-to-Market Coverage 3 Building the Brand 4 Accelerating Growth Strategy 5 Number of Facilities with Markforged Printers Time |
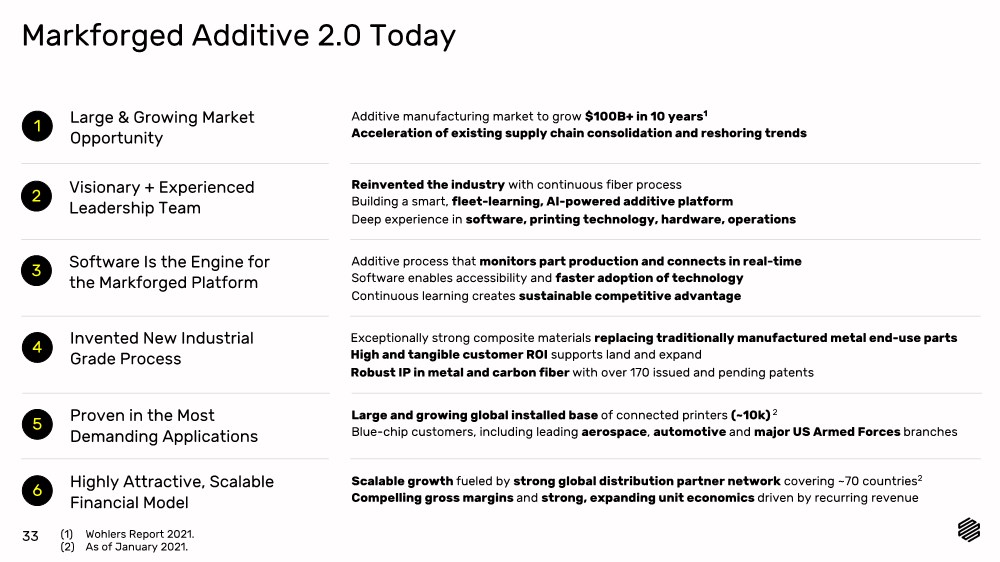
| Markforged Additive 2.0 Today Reinvented the industry with continuous fiber process Building a smart, fleet-learning, AI-powered additive platform Deep experience in software, printing technology, hardware, operations Large & Growing Market Opportunity Additive manufacturing market to grow $100B+ in 10 years1 Acceleration of existing supply chain consolidation and reshoring trends Additive process that monitors part production and connects in real-time Software enables accessibility and faster adoption of technology Continuous learning creates sustainable competitive advantage 33 1 Highly Attractive, Scalable Financial Model Scalable growth fueled by strong global distribution partner network covering ~70 countries2 Compelling gross margins and strong, expanding unit economics driven by recurring revenue 6 Proven in the Most Demanding Applications Large and growing global installed base of connected printers (~10k) 2 Blue-chip customers, including leading aerospace, automotive and major US Armed Forces branches 5 Invented New Industrial Grade Process Exceptionally strong composite materials replacing traditionally manufactured metal end-use parts High and tangible customer ROI supports land and expand Robust IP in metal and carbon fiber with over 170 issued and pending patents 4 Software Is the Engine for the Markforged Platform 3 Visionary + Experienced Leadership Team 2 (1) Wohlers Report 2021. (2) As of January 2021. |
| Financial Overview |

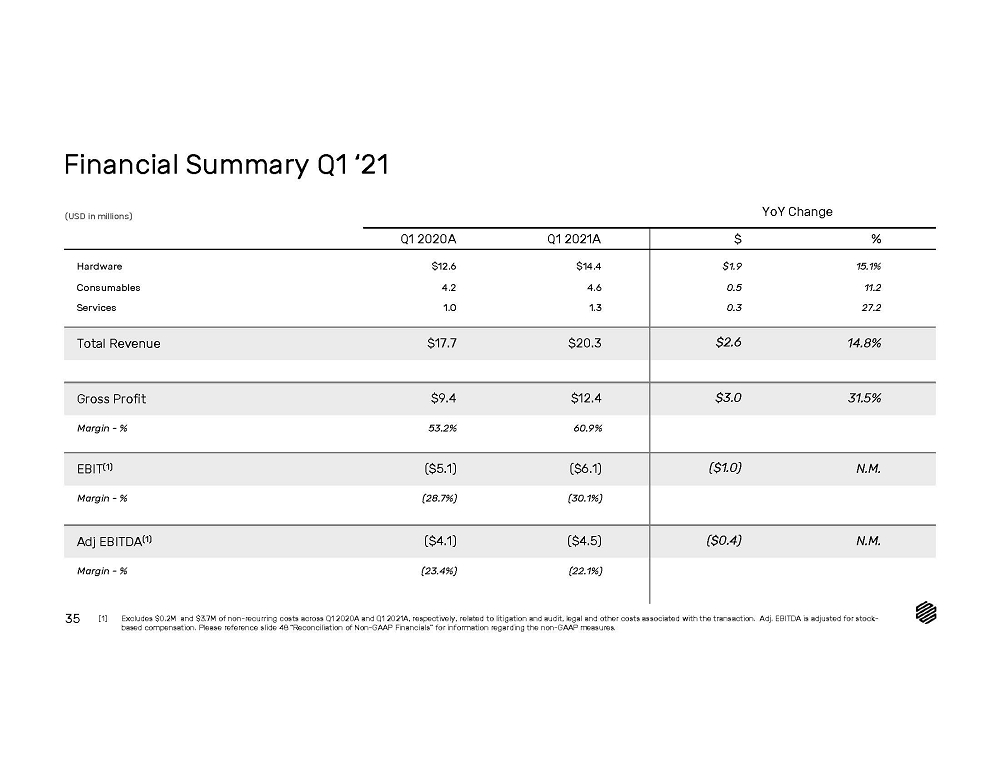
| Gross Profit $9.4 $12.4 $3.0 31.5% Margin - % 53.2% 60.9% EBIT(1) ($5.3) ($9.8) ($4.5) N.M. Margin - % (29.9%) (48.3%) EBITDA(1) ($4.9) ($9.4) ($4.5) N.M. Margin - % (27.4%) (46.2%) Financial Summary Q1 ‘21 (USD in millions) 35 Total Revenue Q1 2020A Q1 2021A $ % YoY Change Services $17.7 1.0 $20.3 1.3 $2.6 0.3 14.8% 27.2 Consumables 4.2 4.6 0.5 11.2 Hardware $12.6 $14.4 $1.9 15.1% (1) Includes one-time transaction expenses related to the SPAC merger, as represented in the S4 financials (2) Excludes $0.6M, $2.1M, and $7.6M of non-recurring costs across 2019A, 2020A, and 2021E, respectively, related to litigation and audit, legal and other costs associated with the transaction. Additionally, no ongoing public company costs are assumed. Adj. EBITDA is adjusted for stock-based compensation. Please reference slide 48 “Reconciliation of Non-GAAP Financials” for information regarding the non-GAAP measures. Footnote to update & cross-check pg # |
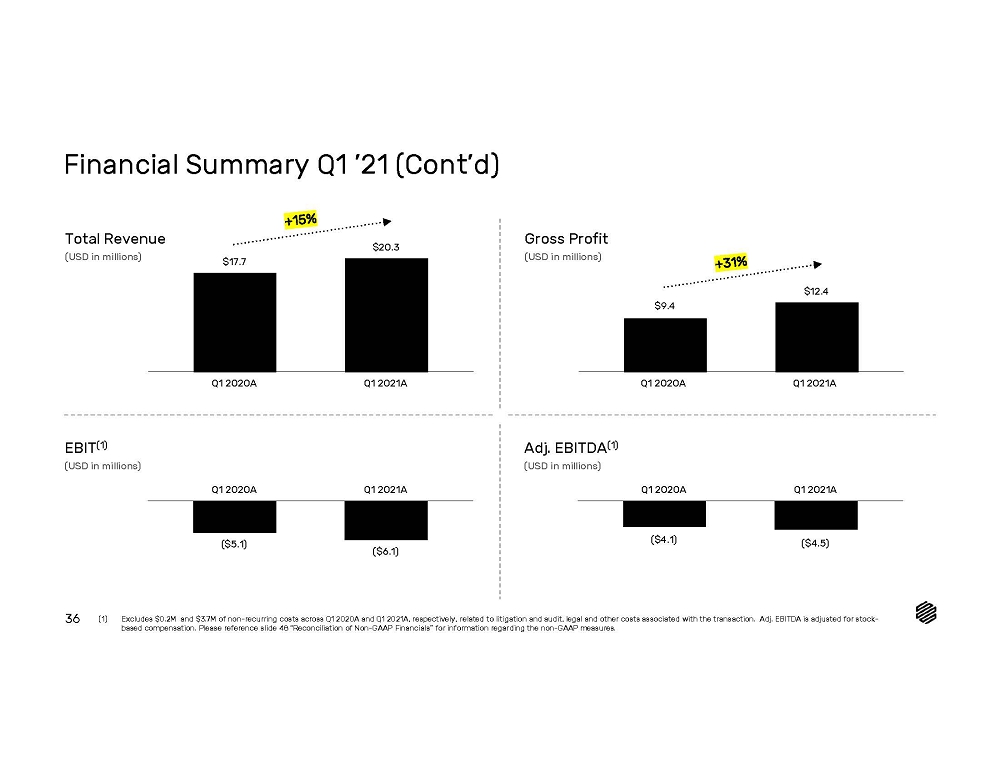
| Financial Summary Q1 ’21 (Cont’d) 36 +15% Total Revenue (USD in millions) (1) Excludes $xxx and $xxx of non-recurring costs across Q1 2020, and Q1 2021, respectively, related to litigation and audit, legal and other costs associated with the transaction. Additionally, no ongoing public company costs are assumed. Adj. EBITDA is adjusted for stock-based compensation. Please reference slide 48 “Reconciliation of Non-GAAP Financials” for information regarding the non-GAAP measures. Q1 2020A Q1 2021A $17.7 $20.3 EBIT(1) (USD in millions) Gross Profit (USD in millions) EBITDA(1) (USD in millions) +31% Q1 2020A Q1 2021A $9.4 $12.4 ($5.3) ($9.8) Q1 2020A Q2 2021A ($4.9) ($9.4) Q1 2020A Q1 2021A Footnote to update & cross-check pg # |
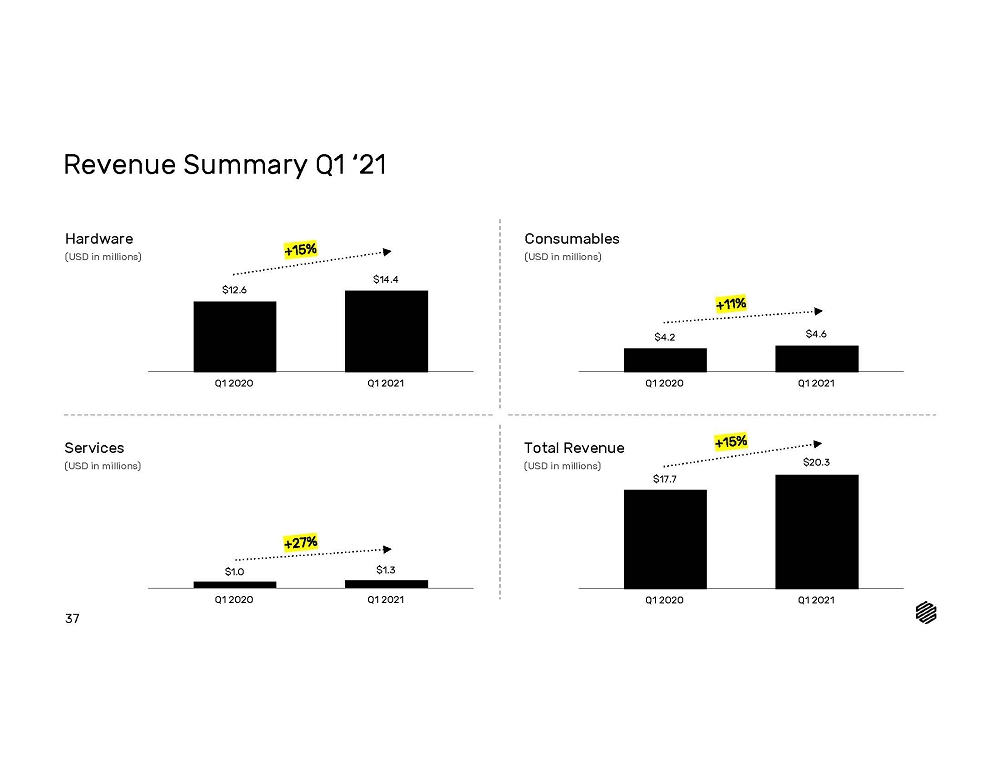
| Revenue Summary Q1 ‘21 37 Hardware (USD in millions) +15% Q1 2020 Q1 2021 $12.6 $14.4 Services (USD in millions) Consumables (USD in millions) Total Revenue (USD in millions) +11% Q1 2020 Q1 2021 $4.2 $4.6 +27% Q1 2020 Q1 2021 $1.0 $1.3 +15% Q1 2020 Q1 2021 $17.7 $20.3 |
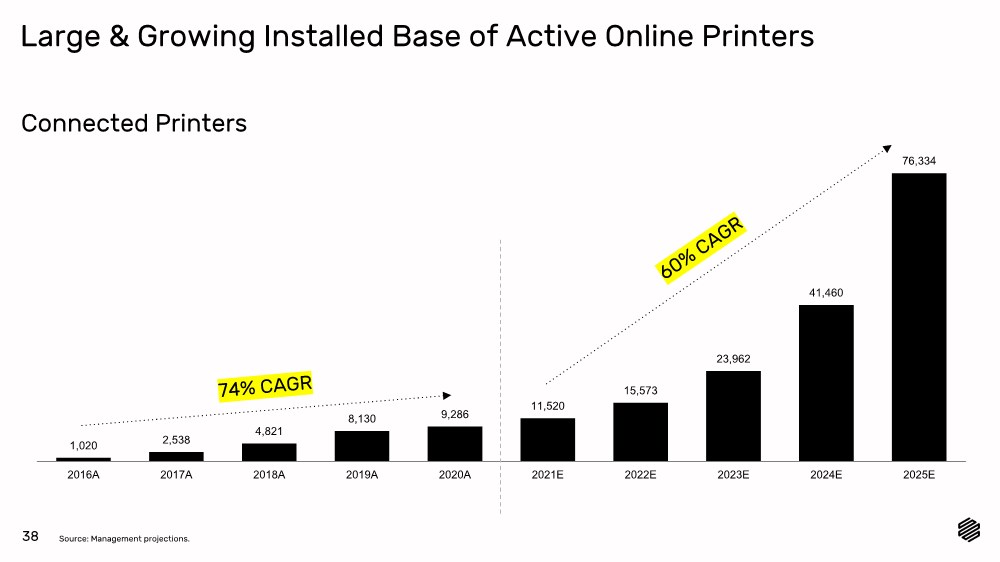
| Large & Growing Installed Base of Active Online Printers 74% CAGR 60 % CAGR Source: Management projections. Connected Printers 38 1,020 2,538 4,821 8,130 9,286 11,520 15,573 23,962 41,460 76,334 2016A 2017A 2018A 2019A 2020A 2021E 2022E 2023E 2024E 2025E |
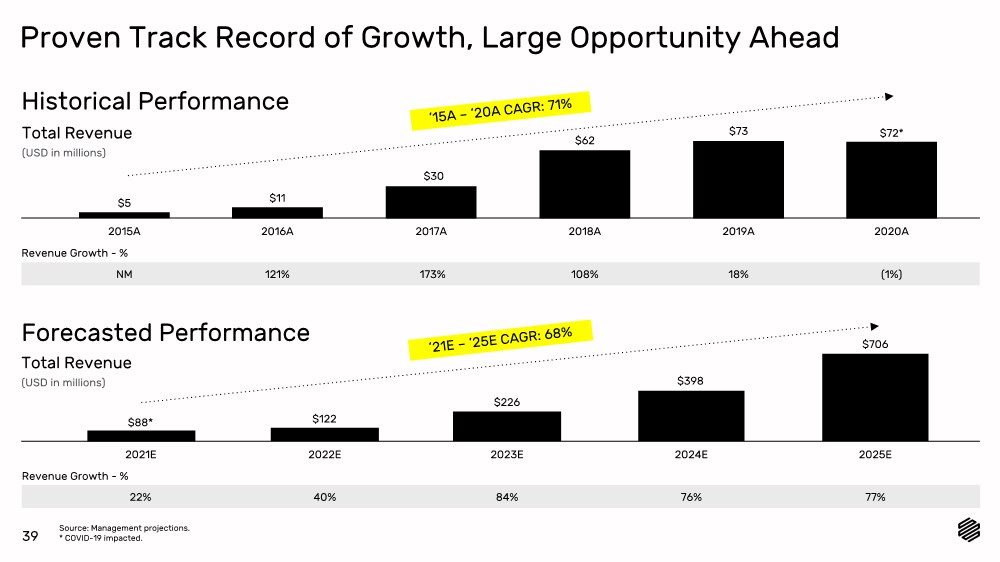
| Proven Track Record of Growth, Large Opportunity Ahead Source: Management projections. * COVID-19 impacted. ’15A – ’20A CAGR: 71% Historical Performance ’21E – ’25E CAGR: 68% 39 Total Revenue (USD in millions) 2015A $5 $11 2016A 2017A 2018A 2019A 2020A $30 $62 $73 $72* Revenue Growth - % NM 121% 173% 108% 18% (1%) 2021E $88* 2022E $122 $226 2023E 2024E $398 $706 2025E Revenue Growth - % 22% 40% 84% 76% 77% Forecasted Performance Total Revenue (USD in millions) |
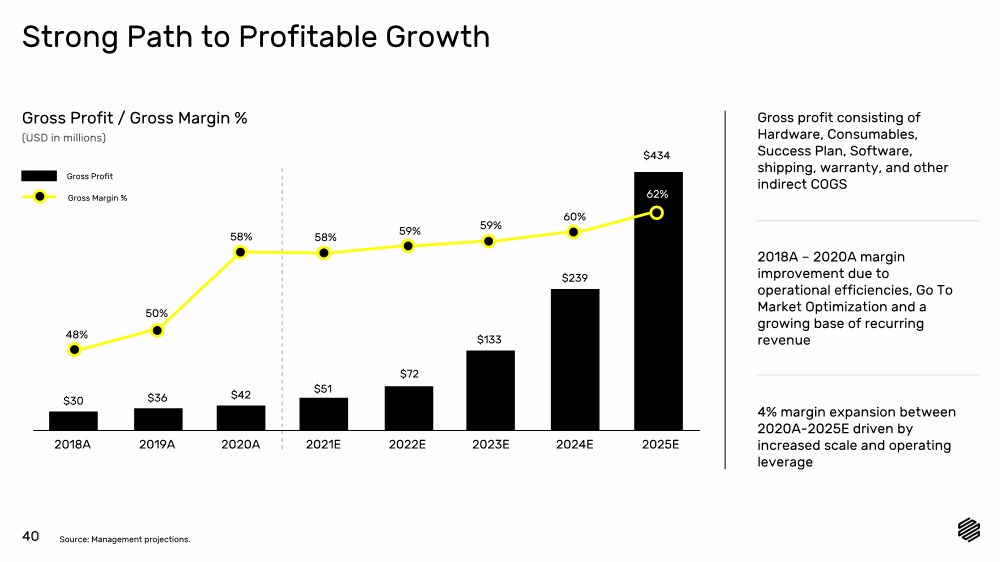
| Strong Path to Profitable Growth 40 Source: Management projections. Gross Profit / Gross Margin % (USD in millions) Gross profit consisting of Hardware, Consumables, Success Plan, Software, shipping, warranty, and other indirect COGS 2018A $30 2019A 2020A 2021E 2022E 2023E 2024E 2025E $434 $239 $133 $72 $51 $72 $42 $36 50% 48% 58% 58% 59% 59% 60% 62% 2018A – 2020A margin improvement due to operational efficiencies, Go To Market Optimization and a growing base of recurring revenue 4% margin expansion between 2020A-2025E driven by increased scale and operating leverage Gross Profit Gross Margin % |
| Strong Path to Profitable Growth (Cont’d) 41 Adj. EBITDA1 2 / Adj. EBITDA1 2 Margin % (USD in millions) Streamlined cost structure during 2020A 2018A ($12) 2019A 2020A 2021E 2022E 2023E 2024E 2025E $172 ($14) ($38) $51 ($10) $42 24% Planned investment in future product development 2021E- 2023E, benefiting from operational leverage in later years ($37) ($27) Adj. EBITDA Adj. EBITDA Margin % (19%) (37%) (14%) (42%) (31%) (6%) 11% Source: Management projections. (1) Excludes $0.6M, $2.1M, and $7.6M of non-recurring costs across 2019A, 2020A, and 2021E, respectively, related to litigation and audit, legal and other costs associated with the transaction. Additionally, no ongoing public company costs are assumed. (2) Adj. EBITDA is adjusted for stock-based compensation. Please reference slide 48 “Reconciliation of Non-GAAP Financials” for information regarding the non-GAAP measures. Highly capital efficient business, generating ~$72mm of 2020 sales on a total of ~$80mm capital invested to date |
| Markforged Illustrative Unit Economics Analysis Source: Management projections. (1) 2023E and after. (2) Cumulative gross profit over average customer life of 8 years (excluding customer acquisition costs). Illustrative Gross Profit per Printer (USD in 000’s) 64% 68% Gross Profit - % Immediate Payback Upon Initial Transaction 42 ($9.9) CAC $14.9 $10.5 $25.4 Initial Transaction Years 2-8 LTV Tomorrow1 Illustrative Gross Profit per Printer (USD in 000’s) ($5.1) CAC $16.4 $21.0 $37.4 Initial Transaction Years 2-8 LTV 68% 76% Gross Profit - % Key Metrics LTV: ~$25.4k2 LTV / CAC: ~2.6x Includes ~$20k upfront hardware sale Key Metrics LTV: ~$37.4k2 LTV / CAC: ~7.3x Gross Profit - % Gross Profit - % Immediate Payback Upon Initial Transaction Today |
| Transaction Overview & Valuation |

| Detailed Transaction Overview Note: Excludes impact of the exercise of Sponsor or IPO warrants which both have a strike price of $11.50. Percentages may not sum to 100% given rounding. (1) Excludes shares reserved for issuance under management equity incentive plan. (2) Assumes $10.00 share price and no redemptions from public shareholders. (3) Includes 161.1M existing Markforged equity holders shares, 21.5M SPAC IPO shares, 2.7M SPAC sponsor shares, and 21.0M PIPE Investor shares. (4) Excludes 2.7mm SPAC sponsor shares vesting in 1.3mm share increments at $12.50 and $15.00. (5) Excludes additional seller earn-out of 8.0M shares that vest at $12.50 and 6.7M shares that vest at $15.00. Values in Millions Except per Share and Percentage Data Sources & Uses Pro Forma Valuation & Ownership 1 2 3 4 5 Sources Pro Form a Valuation Existing Shareholders Rollover Equity 1 $1,611 Share Price $10.00 SPAC Cash in Trust2 $215 Shares Outstanding 206 PIPE Financ ing $210 Pr o For ma Equity V alue $2,062 Current Net Cas h $54 (-) Pro Forma Net Cash ($399) Total Sources $2,089 Pro Forma Enterprise Value $1,664 Us e s Pro Form a Ow nership Ownership Summary For Pie Chart Ex is ting Shar eholder s Equity 1 $1,611 Cash to Balance Sheet $399 Transaction Expenses $35 Cas h to Sellers $45 Total Uses $2,089 Existing Shareholders 78% SPAC IPO Investors 10% SPAC Sponsor 1% PIPE Investors 10% (4) Transaction close anticipated in Summer 2021 44 |
|

| Appendix |

| Financial Summary (USD in millions) 47 Source: Management projections. (1) Excludes $0.6M, $2.1M, and $7.6M of non-recurring costs across 2019A, 2020A, and 2021E, respectively, related to litigation and audit, legal and other costs associated with the transaction. Additionally, no ongoing public company costs are assumed. Adj. EBITDA is adjusted for stock-based compensation. Please reference slide 48 “Reconciliation of Non-GAAP Financials” for information regarding the non-GAAP measures. Year Ended December 31, 2018A 2019A 2020A 2021E 2022E 2023E 2024E 2025E Total Revenue $61.7 $72.6 $71.9 $87.6 $122.5 $225.7 $397.6 $705.8 Growth - % 108.3% 17.7% (1.0%) 21.9% 39.9% 84.3% 76.2% 77.5% Gross Profit $29.7 $36.3 $42.0 $50.7 $71.7 $133.3 $238.7 $434.1 Margin - % 48.1% 49.9% 58.4% 57.9% 58.6% 59.1% 60.0% 61.5% EBIT(1) ($12.8) ($29.2) ($14.3) ($42.0) ($45.1) ($23.8) $29.7 $156.0 Margin - % (20.7%) (40.3%) (19.9%) (48.0%) (36.9%) (10.5%) 7.5% 22.1% Adj. EBITDA(1) ($11.6) ($27.0) ($10.0) ($36.6) ($37.9) ($14.2) $42.2 $171.9 Margin - % (18.8%) (37.1%) (13.9%) (41.7%) (30.9%) (6.3%) 10.6% 24.4% |
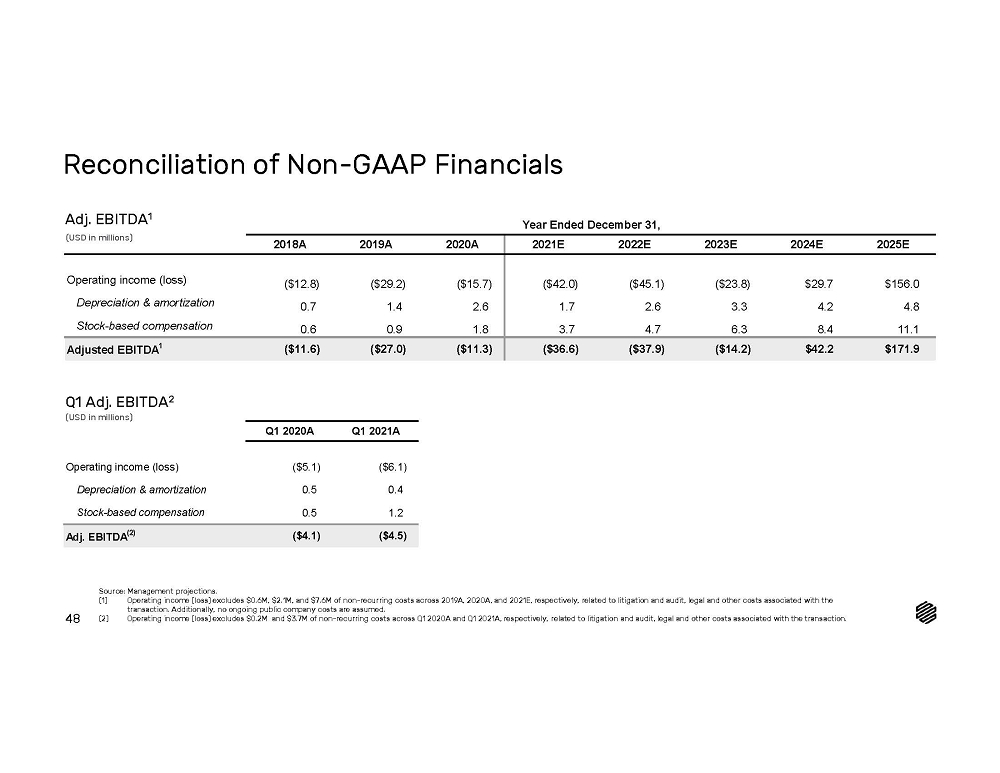
| Year Ended December 31, 2018A 2019A 2020A 2021E 2022E 2023E 2024E 2025E Operating income (loss) ($12.8) ($29.2) ($14.3) ($42.0) ($45.1) ($23.8) $29.7 $156.0 Depreciation & amoritization 0.7 1.4 1.8 1.7 2.6 3.3 4.2 4.8 Stock-based compensation 0.6 0.9 2.5 3.7 4.7 6.3 8.4 11.1 Adjusted EBITDA1 ($11.6) ($27.0) ($10.0) ($36.6) ($37.9) ($14.2) $42.2 $171.9 Reconciliation of Non-GAAP Financials (USD in millions) Adj. EBITDA1 Year Ended December 31, 2018A 2019A 2020A 2021E 2022E 2023E 2024E 2025E Cash Flow from Operations ($17.6) ($30.7) ($7.4) ($44.7) ($46.4) ($29.7) $12.7 $116.2 Capital Expenditures (1.7) (4.7) (0.5) (2.0) (6.8) (7.6) (4.2) (5.6) Free Cash Flow1 2 ($19.3) ($35.3) ($7.9) ($46.7) ($53.2) ($37.4) $8.5 $110.6 Free Cash Flow1 2 Source: Management projections. (1) Excludes $0.6M, $2.1M, and $7.6M of non-recurring costs across 2019A, 2020A, and 2021E, respectively, related to litigation and audit, legal and other costs associated with the transaction. Additionally, no ongoing public company costs are assumed. (2) Includes change in restricted cash and other long-term liabilities across 2018A - 2021E. 48 (USD in millions) Footnote to update |
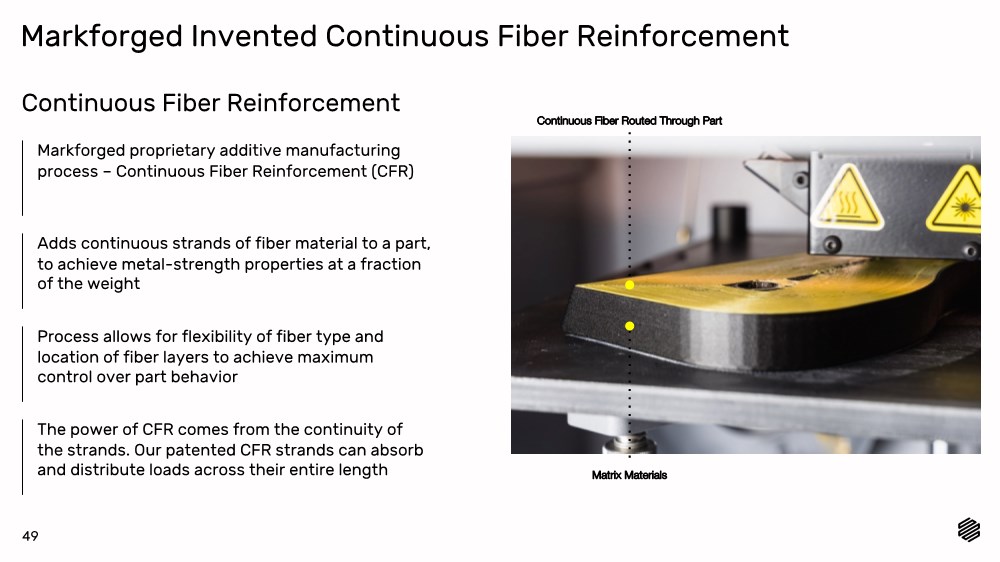
| Continuous Fiber Reinforcement Markforged proprietary additive manufacturing process – Continuous Fiber Reinforcement (CFR) Adds continuous strands of fiber material to a part, to achieve metal-strength properties at a fraction of the weight Process allows for flexibility of fiber type and location of fiber layers to achieve maximum control over part behavior Markforged Invented Continuous Fiber Reinforcement The power of CFR comes from the continuity of the strands. Our patented CFR strands can absorb and distribute loads across their entire length Continuous Fiber Routed Through Part Matrix Materials 49 |
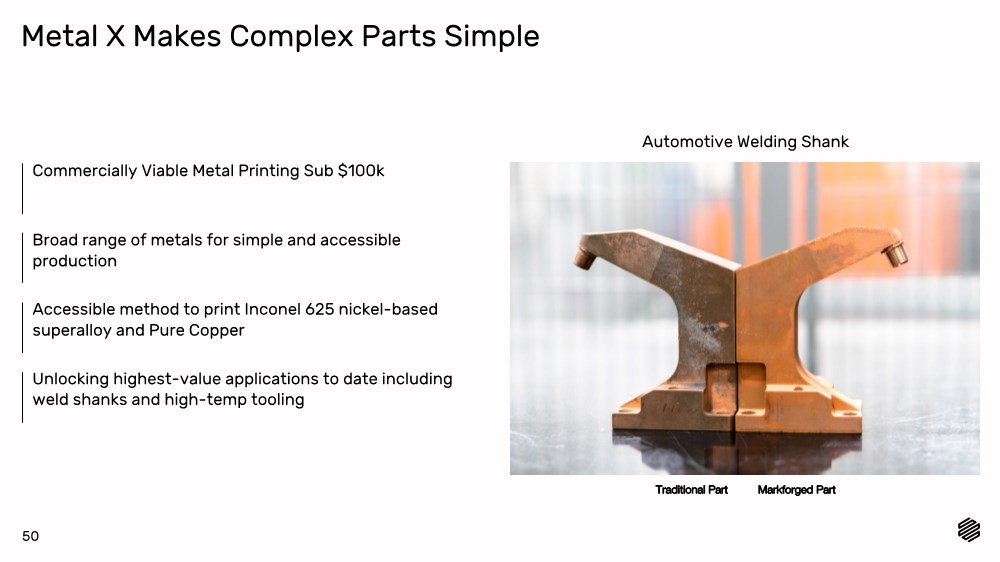
| Metal X Makes Complex Parts Simple Broad range of metals for simple and accessible production Accessible method to print Inconel 625 nickel-based superalloy and Pure Copper Unlocking highest-value applications to date including weld shanks and high-temp tooling Commercially Viable Metal Printing Sub $100k Traditional Part Markforged Part Automotive Welding Shank 50 |
|
